| The graph to the right represents the given equation h=2.415sin(pi/6(t-2.567))+12.25 with calculations worked out below. The graph also includes a line of y=12 to clearly display the months that had 12 or more hours of sunlight. The calculations show that 6 months of the year (months 3-8) had 12+ hours of sunlight. Because the number of days within a month vary, the days of March - August needed to be calculated (shown right). It appears that 184 days of the year Yuma has sunlight for 12 or more hours. Since half of a year is only 182.5 days, Cress' sunlight requirements will be met. | 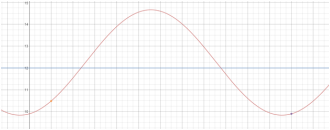 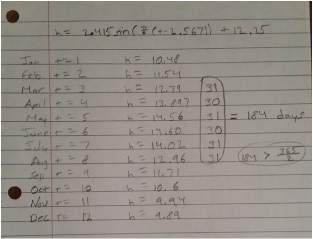 |
|
0 Comments
This project displayed how something simple like csc(x) could be "stretched out", and how a more complicated expression such as (1+secx)/(tanx+sinx) can be condensed. What's interesting about this is that there are many different ways to write a more complex version of cscx. That's actually where the challenge came from; deciding how far the equation on the left should be carried out. My project could have much simpler, or much harder. Creating a verification equation has many different possibilities.
This activity helped me see how sin, cos, and tan all affect the y values on the Cartesian plane. I think my biggest takeaway was learning that sin is rise, cos is run, and tan is rise over run. Up until this point, I didn't really understand the difference between something like sin(pi) and cos(pi). They're both the same angle on a circle graph, so they were essentially the same thing to me. Along with the special graphs, this activities allowed me to make the connection between the circle graph and the Cartesian plane. During the assessment without Mr. Cresswell, I was honestly winging it. The two special graphs were what enabled me to pass. Not knowing if i was right or wrong until the end was stressful to say the least.
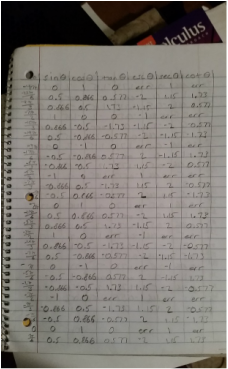
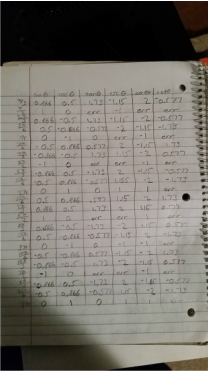
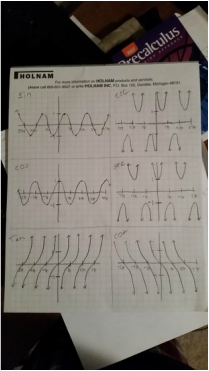
With the exception of tangent and cotangent which equal pi , the periods of every graph is 2 pi. Amplitudes of the sin and cos are 2, and there is no applicable amplitude for the tangent, secant, cosecant, and cotangent graphs. The sine and cosine graphs show similarities, but the y-intercepts are different on each which would indicate that there is a horizontal shift. In fact, the cos and sin graphs could be identical if the c and d values were changed appropriately. The periods and amplitudes of the two graphs are the same, so you wouldn't need to add an a or b value. Tan, csc, sec, and cot have different vertical asymptotes at certain values because, for example, cot can also be defined as 1/tan x; when tan of x is 0, the cot ends up as an error. It results in an error because it equals 1/0, and you cannot divide by 0.
|
AuthorWrite something about yourself. No need to be fancy, just an overview. Archives
September 2015
Categories |
 RSS Feed
