The equation for this function is y = 1.2^(x-7.3). The domain of this function is x = any real number, and the range is y > 0.
According to the article, sales declined one year. Because of this, the graph would no longer rise at it constant rate, thus rendering the formula inaccurate.
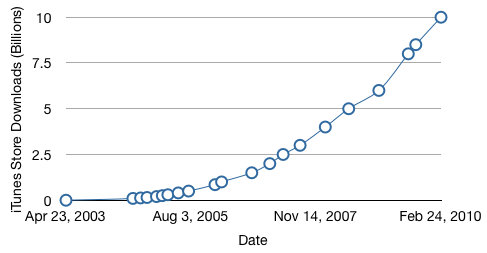
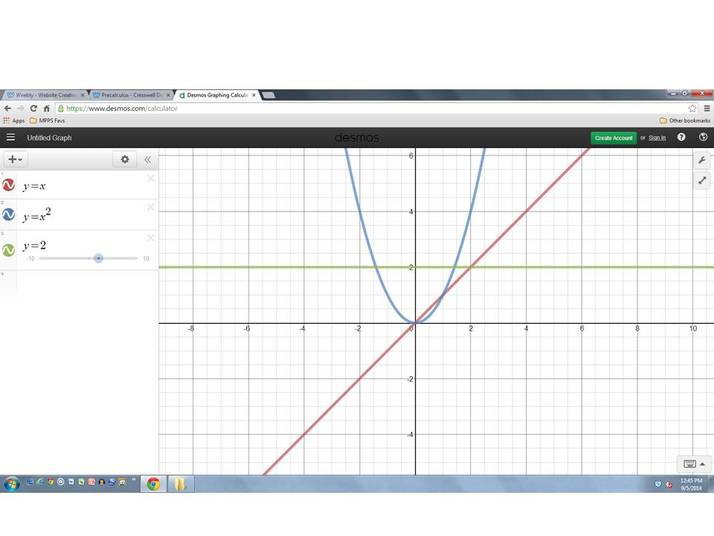
This function displays exponential growth.
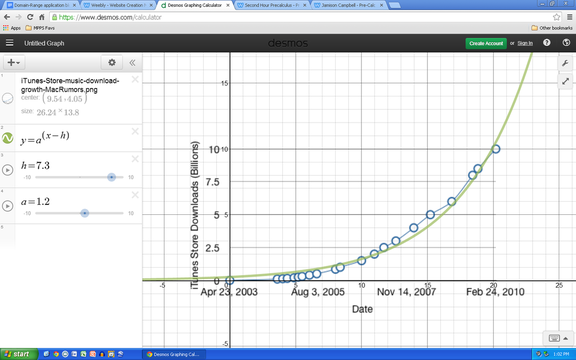
0 Comments
First off, I inserted the picture into the GeoGebra graph. Then, I plotted points on each basketball. After that, I selected the fitpoly option which gave me a line of best fit. With the line of best fit, I am now able to see that the ball will go into the basket.
A) At all three ramp heights, I clearly underestimated the acceleration and maximum distance reached by the skateboard. With the 21 inch ramp, I predicted it to reach a max distance of 55 feet after 25 seconds, and remain at that distance. However, the actual results showed the skateboard reaching a max distance of of approximately 63 feet after 13 seconds, then rolling back to 15 feet by the time 40 seconds had passed. My predictions for the 14 inch ramp turned out much better than the previous. My predicted acceleration and the actual acceleration turned out much similar to each other. The only clear difference is that I predicted the skateboard slowing down sooner, resulting in a max distance of 47 feet after 22 seconds (then falling back to 15 feet by 40 seconds) when it actually kept a higher speed and reached a greater max distance of approximately 56 feet, then dropping back to 20 feet after 40 seconds. My initial predictions for the 7 inch ramp started extremely well. I guessed a nearly identical acceleration to that of the actual results. But yet again, my prediction called for a shorter max distance than what it would actually turn out to be. While the 7 inch ramp started out as my most accurately predicted graph, it turned out to be my most inaccurate graph in terms of where the skateboard ended up after 40 seconds. I predicted that the skateboard would reach a max distance of 33 feet and after 25 seconds falling back to 0 feet. This was significantly different from what actually happened: reaching a max distance of 40 feet and remaining at that length indefinitely.
B) The zeros represent the starting point of the skateboard: 0 feet. C) When looking at the results of these graphs, there are several different trends to be seen. The first is in the zeros of the graphs. It would appear that the more the ramp raises in height, the more the value of x decreases . When it comes to the maximum distance reached, the skateboard reached greater distances with a higher ramp. Basically, a higher ramp equaled a greater max difference, but a lower x value and/or ending point. D) A higher ramp resulted in a faster rising slope on the graph. However, the faster the slope rose, the faster slope fell. This means that the faster the board traveled forward, the faster it traveled backwards. Graph (a) shows the flag rising consistently with the time. Graph (b) shows the flag rising quickly, then slowing down. Graph (c) shows rapid successions of speeding up and slowing down. Graph (d) shows the flag rising slowing, then speeding up. Graph (e) starts out slow, speeds up, then slows down again. Graph (f) was an attempt to rip time and space open into another dimension. The speed at which this flag was raised is incalculable. This dude deserves a medal. My first line is an identity function. Because y=2, no matter what x is, the y vertice will always be 2. My second line is a constant function, for every increase in x value, there will be an equivalent increase in y value. My third line is a quadratic function. It's in the shape of a
|
AuthorWrite something about yourself. No need to be fancy, just an overview. Archives
September 2015
Categories |