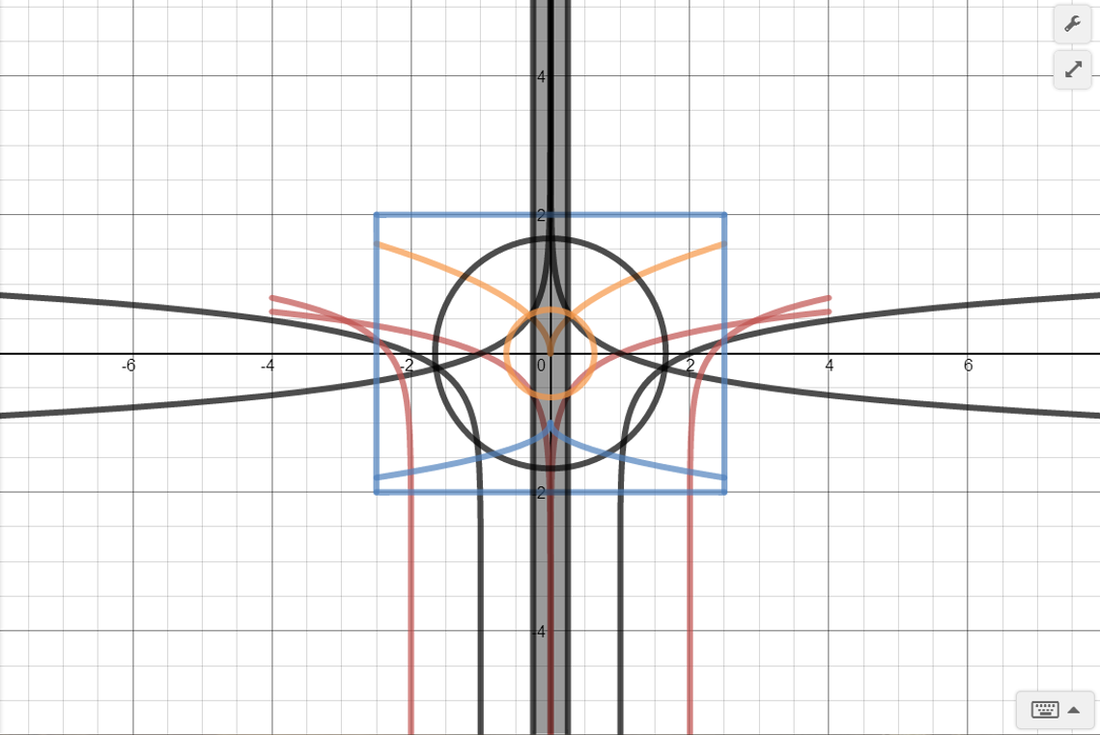
 | In my first graph, I primarily focused on the use of logarithms. There are two parent log(x) functions, and then two inverses of that parent function. The normal parents have an asymptote at y=1, likewise, the inverts have inverted asympotes on the y-axis. Both have an asymptote at x=0. It should also be noted that the inverted log function has a limited domain of (-4,4). There are several other log functions present that have different positions than the parent because of added and subtracted variables, both inside and/or out of the parenthesis that contain x. Their asymptotes change accordingly. Their are also elementary functions included such as y=2, and x=2. This is the source of the straight lines. The circles come from two different variations of (x^2)+(y^2). For this piece, I wanted to see functions emerge from point (0,0). That's why there's so many log functions around the origin. The circles and squares serve to draw focus to the center of the graph. |
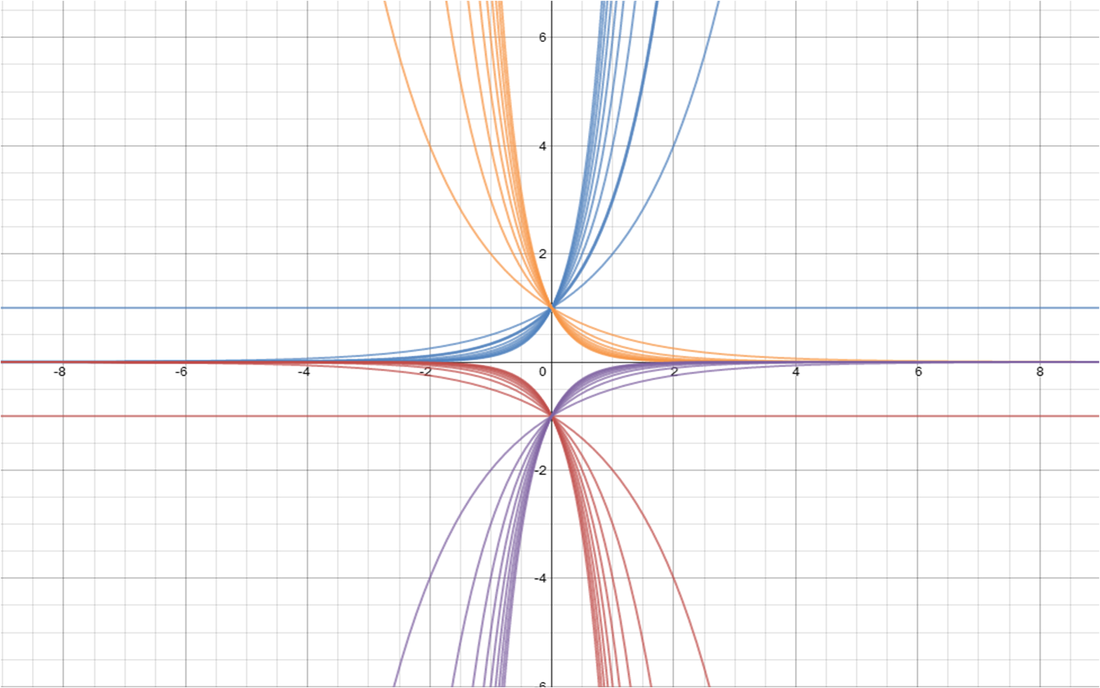 | My second graph uses exponential growth and decay functions, with all positive functions going through the point (0,1) and all negative functions going through the point (0,-1). All positive whole numbers are blue, all negative whole numbers are red, all positive rational numbers are orange, and all negative rational numbers are purple. There are also horizontal lines at y=1 and y=-1. This is because two of the functions being used are f(x)=1*1^x. For this graph, I took some similar ideas of what I used in my first graph, but i wanted things to feel more free/endless. That's why their aren't any limitations on the domain or range. |
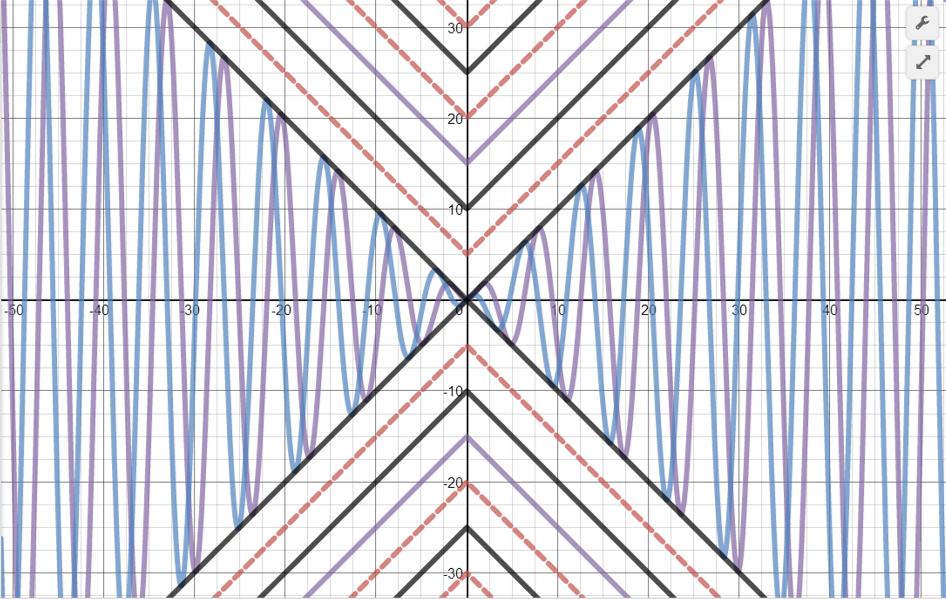 | My last graph was all about the operations of functions and absolute value equations. I put in both y=xsinx and y=xcosx. You can see that the sin and cos functions become larger at each interval and that there is a linear relationship for these intervals. This is because they are multiplied by x. The absolute value functions do a great job of pointing this out. I'm not entirely sure where my inspiration came for this one. I wanted to see the waves of sin and cos, then i just figured the absolute value functions would look cool. It just kind of happened. |
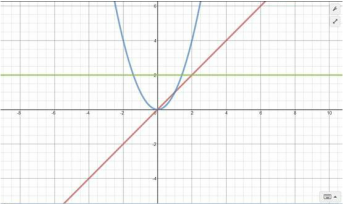 | As much as I regret to admit it, yes, this is the "art" I created in the beginning of the trimester. Obviously, there was a significant lack of inspiration when this piece was created. It's trash. However, it may be entirely because I didn't know how to make quality Desmos art at the time. All of the equations and functions discussed in class, especially the ones used above, helped contribute to pieces made in this final project. I came into this class without a clue on what how lines looked on a graph. Part of that could've been do to the whole summer break thing, but this class served as really good refresher coarse, and enabled me to create some interesting pieces of art - unlike that first thing i made. |
 RSS Feed
